はじめに †
WindowsでAnacondaを使ってデータ分析を行う環境を整えます。
この記事の内容は、以下のバージョンで確認しました。
- Windows 10
- Anaconda 5.3 Python 3.7 version
インストール †
AnacondaのPython 3バージョンをダウンロードして、インストールします。

動作確認 †
Jupyter Notebook †
Windowsのスタートメニューの Anaconda3 (64it) フォルダーから Jupyter Notebook を選択し、起動します。
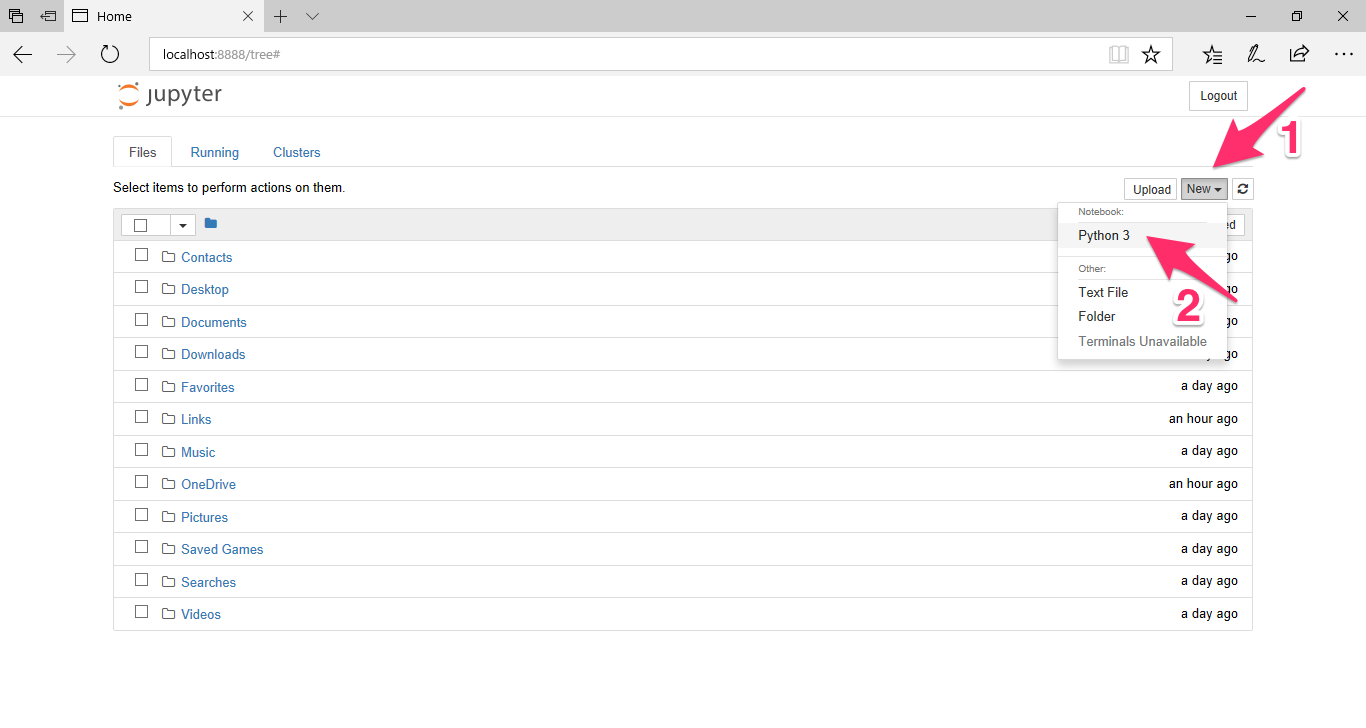
ブラウザが開いたら、New から Python 3 を選択します。
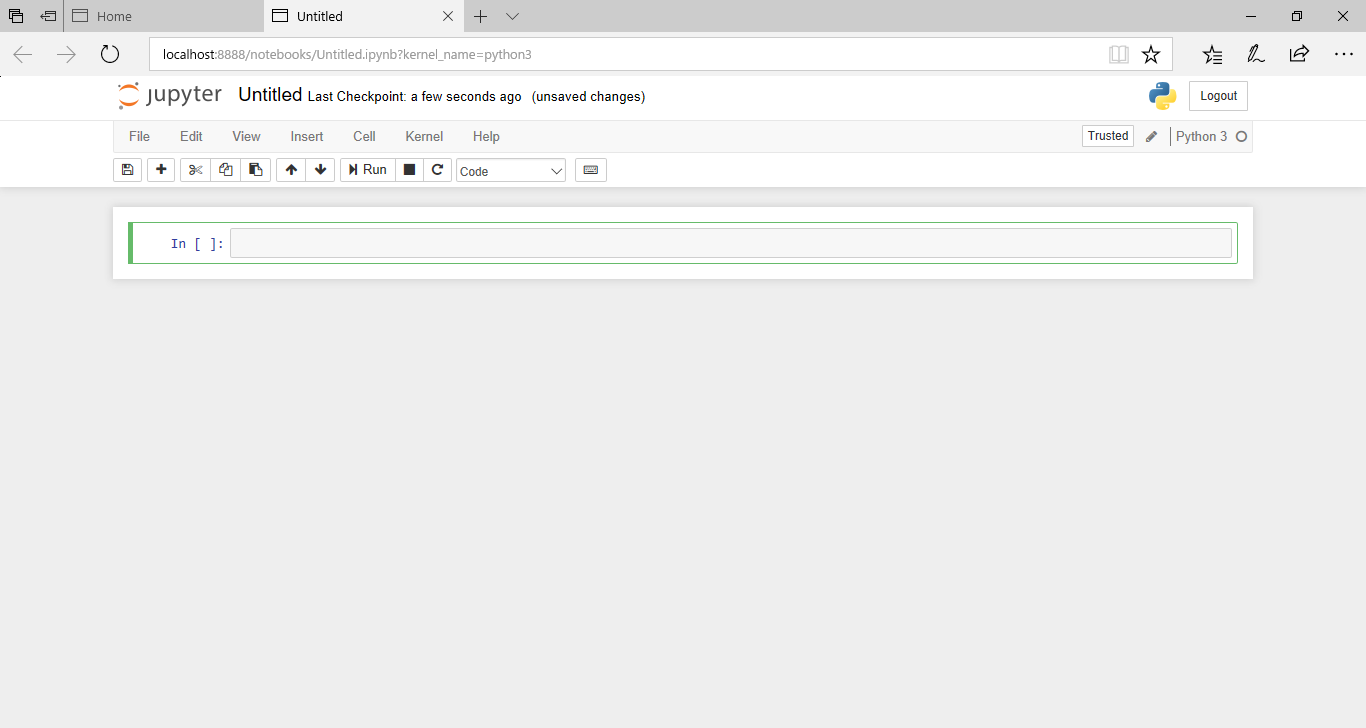
すると、新しいノートブックが作成されます。
scikit-learn †
標準で入っているirisデータをSVM (SVC)で学習してみます。
入力ボックスにPythonのプログラムを入力し、実行ボタンをクリックするか、Shiftキーを押しながらreturnキーを押して実行します。
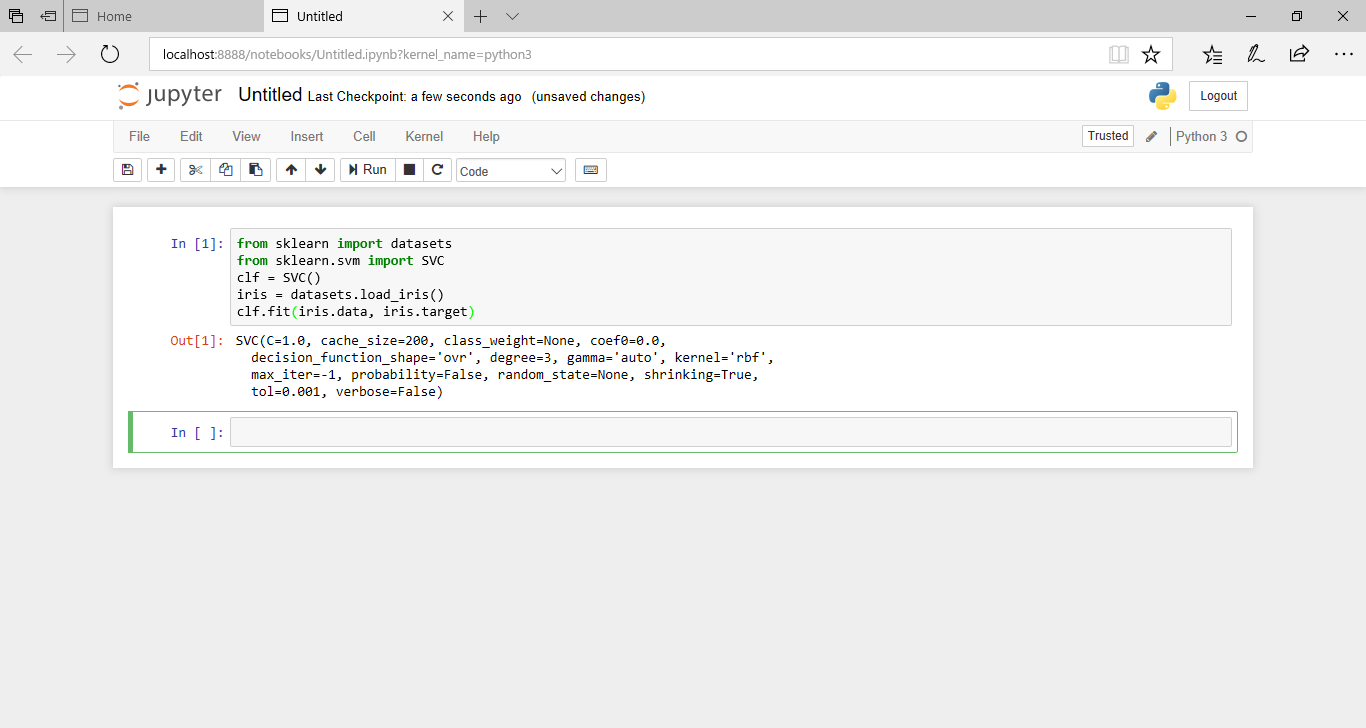
from sklearn import datasets
from sklearn.svm import SVC
clf = SVC()
iris = datasets.load_iris()
clf.fit(iris.data, iris.target)
pandas †
pandasの動作を確認するため、irisデータをpandasに入れます。
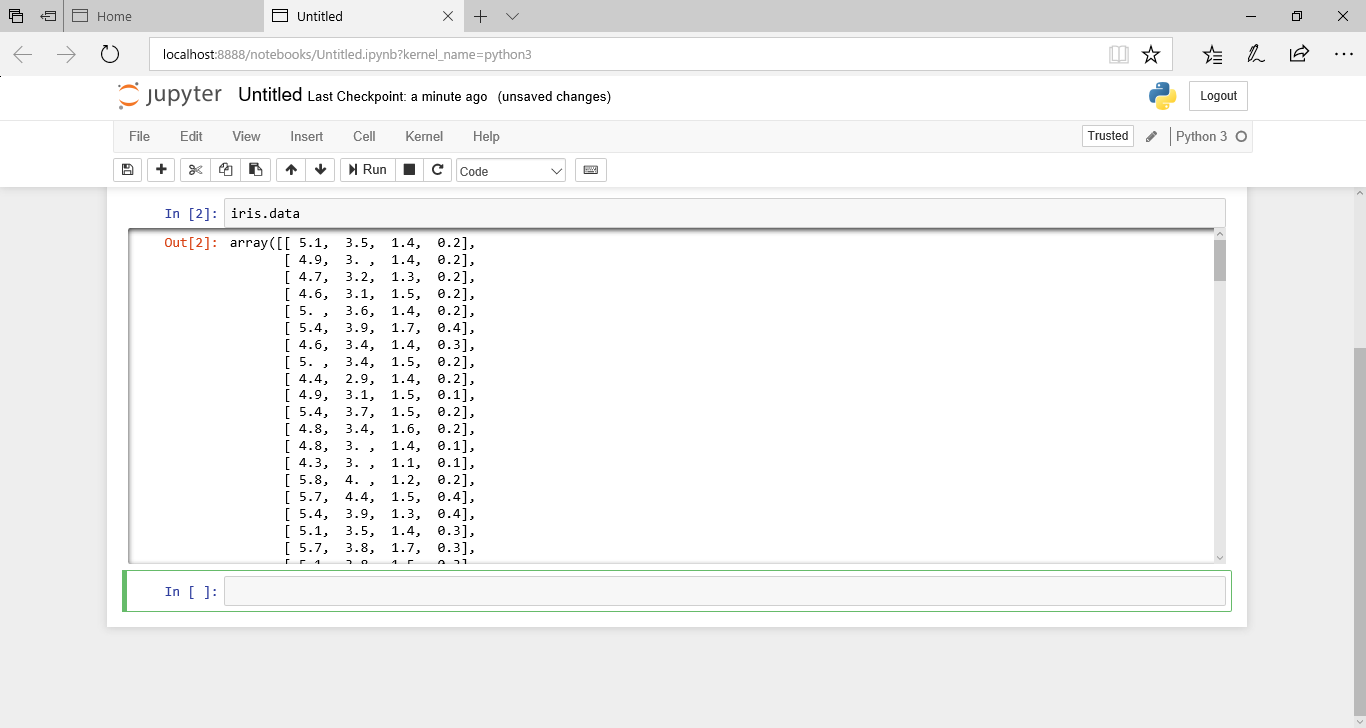
まずは、irisのデータをそのまま表示してみます。
iris.data
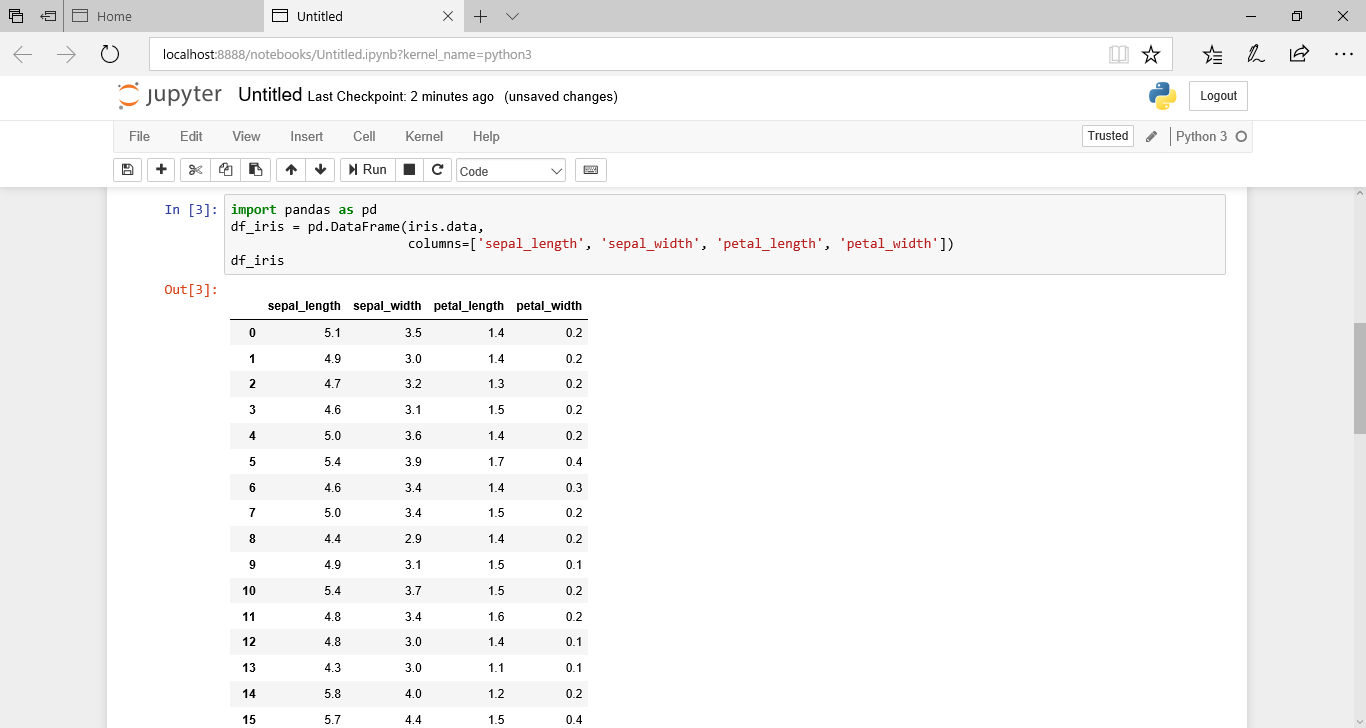
次に、iris.dataをpandasのデータフレームに入れて表示してみます。
import pandas as pd
df_iris = pd.DataFrame(iris.data, columns=['sepal_length', 'sepal_width', 'petal_length', 'petal_width'])
df_iris
Matplotlib †
Matplotlibを使って、グラフを描いてみます。
まず、予測値をpandasのデータフレームに追加します。
iris.df['predict'] = clf.predict(iris.data)
iris.df
次に、予測した値によって、3つのグループに分けます。
x0 = df_iris[df_iris.predict==0]['sepal_length']
y0 = df_iris[df_iris.predict==0]['sepal_width']
x1 = df_iris[df_iris.predict==1]['sepal_length']
y1 = df_iris[df_iris.predict==1]['sepal_width']
x2 = df_iris[df_iris.predict==2]['sepal_length']
y2 = df_iris[df_iris.predict==2]['sepal_width']
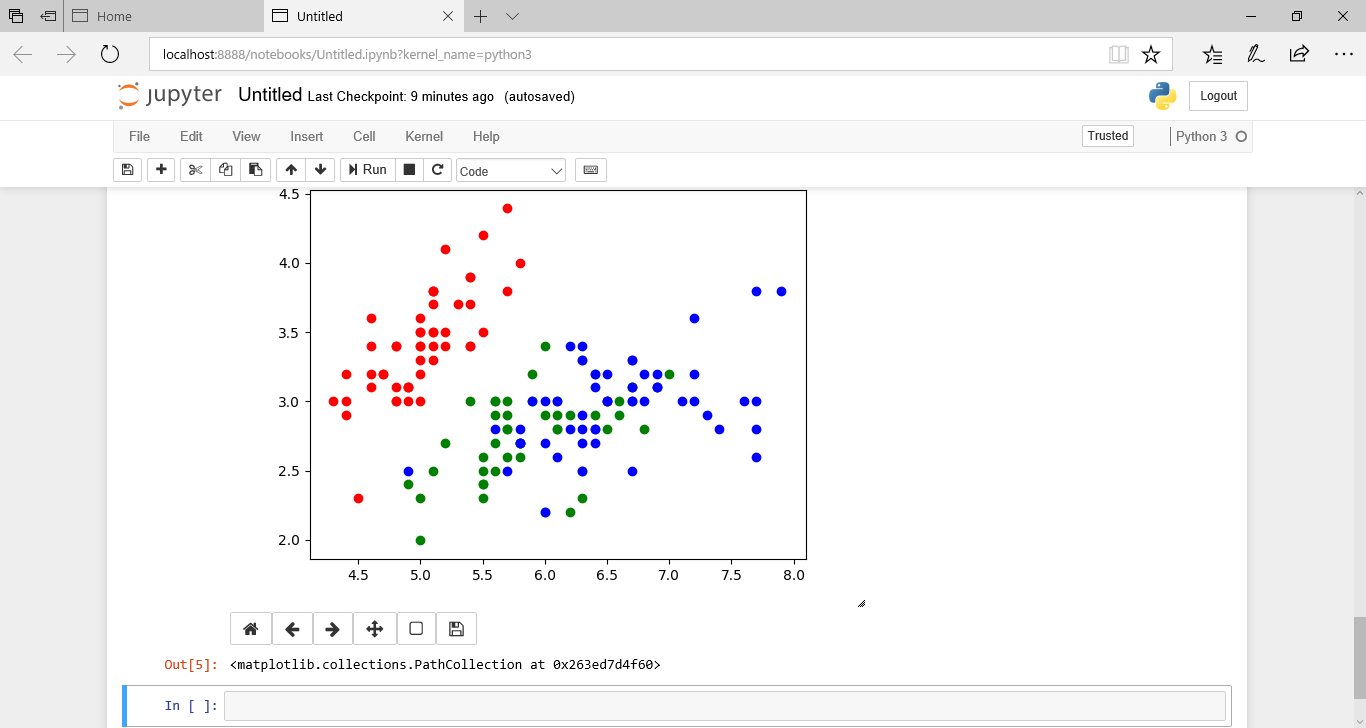
これをMatplotlibで表示します。
%matplotlib notebook
import matplotlib.pyplot as plt
fig = plt.figure()
subplt = fig.add_subplot(1, 1, 1)
subplt.scatter(x0, y0, c='red')
subplt.scatter(x1, y1, c='green')
subplt.scatter(x2, y2, c='blue')
![[PukiWiki] [PukiWiki]](https://xn--p8ja5bwe1i.jp:443/wiki/image/banner.png)