- バックアップ一覧
- 差分 を表示
- 現在との差分 を表示
- ソース を表示
- 機械学習/Pythonでデータ分析するはじめの一歩(Windows編) へ行く。
- 1 (2017-09-18 (月) 13:29:23)
- 2 (2017-09-18 (月) 16:15:48)
- 3 (2017-09-19 (火) 18:18:27)
- 4 (2017-09-19 (火) 19:06:41)
はじめに †
- Windows 10
- Python 3.6.2
- Wheel 0.30.0
- NumPy 1.13.1
- SciPy 0.19.1
- scikit-learn 0.19.0
- Jupyter Notebook 1.0.0
- Matplotlib 2.0.2
インストール †
Python 3 64ビット版 †
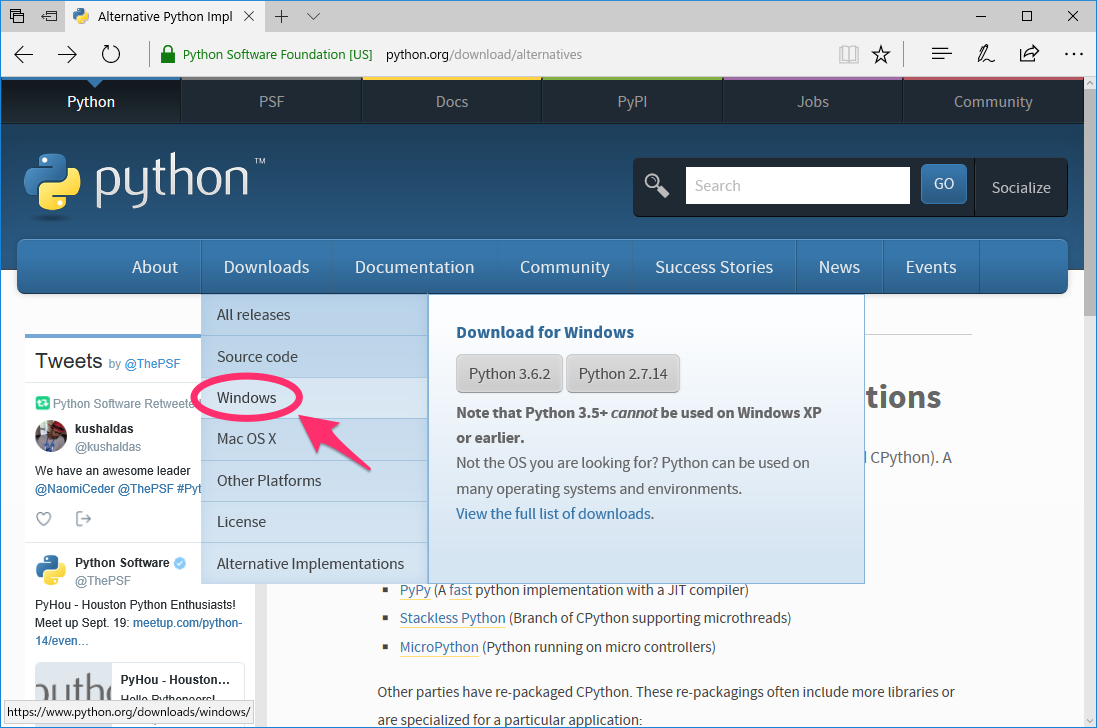
まず、Pythonのオフィシャル・サイトからPython 3の64ビット版インストーラーをダウンロードします。
「Downloads」の「Windows」をクリックし、リストの中にあるWindows x86-64 executable installerをダウンロードします。
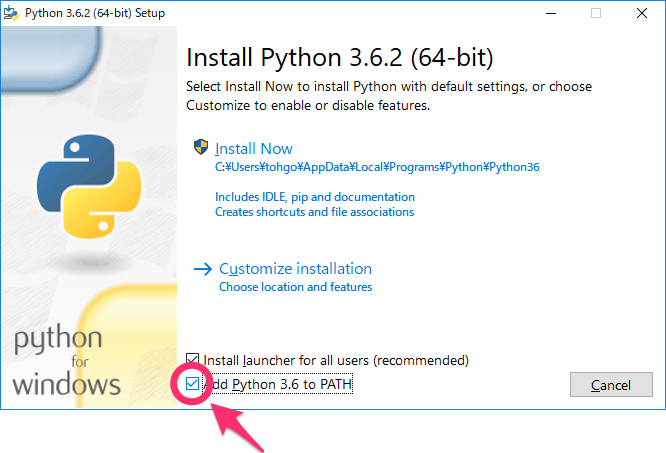
インストーラーを実行したら、Add Python 3.6 to PATHにチェックを入れて、Install Nowをクリックします。
Wheel †
Pythonのライブラリーは、pipを使ってインストールします。
pipはコマンド・プロンプト上で実行しますが、インストールを行いますので、管理者として実行する必要があります。
そこで、WindowsメニューのWindowsシステムツールにあるコマンド プロンプトを右クリックし、管理者として実行を選択します。

標準のライブラリーをインストールすればいい場合は、次のようにしてインストールできます。
from sklearn import datasets
from sklearn.svm import SVC
clf = SVC()
iris = datasets.load_iris()
clf.fit(iris.data, iris.target)
NumPy †
次のサイトから、numpy‑1.13.1+mkl‑cp36‑cp36m‑win_amd64.whlをダウンロードします。
pipでダウンロードしたファイルを指定し、インストールします。
iris.data
ここで、tohgorohはユーザー名なので、自分のユーザー名に置き換えてください。
SciPy †
NumPyと同じように、scipy‑0.19.1‑cp36‑cp36m‑win_amd64.whlをダウンロードしてインストールします。
import pandas as pd
df_iris = pd.DataFrame(iris.data, columns=['sepal_length', 'sepal_width', 'petal_length', 'petal_width'])
df_iris
pandas †
Wheelと同じように、通常のライブラリーをインストールできます。
iris.df['predict'] = clf.predict(iris.data)
iris.df
scikit-learn †
Wheelと同じように、通常のライブラリーをインストールできます。
x0 = df_iris[df_iris.predict==0]['sepal_length']
y0 = df_iris[df_iris.predict==0]['sepal_width']
x1 = df_iris[df_iris.predict==1]['sepal_length']
y1 = df_iris[df_iris.predict==1]['sepal_width']
x2 = df_iris[df_iris.predict==2]['sepal_length']
y2 = df_iris[df_iris.predict==2]['sepal_width']
Jupyter Notebook †
Wheelと同じように、通常のライブラリーをインストールできます。
%matplotlib notebook
import matplotlib.pyplot as plt
fig = plt.figure()
subplt = fig.add_subplot(1, 1, 1)
subplt.scatter(x0, y0, c='red')
subplt.scatter(x1, y1, c='green')
subplt.scatter(x2, y2, c='blue')
Matplotlib †
Wheelと同じように、通常のライブラリーをインストールできます。
> pip install matplotlib
動作確認 †
Jupyter Notebook †
まず、コマンド・プロンプトから、Jupyter Notebookを起動します。
> jupyter notebook
すると、ローカルでWebサーバーが起動し、Webブラウザが自動的に起動します。
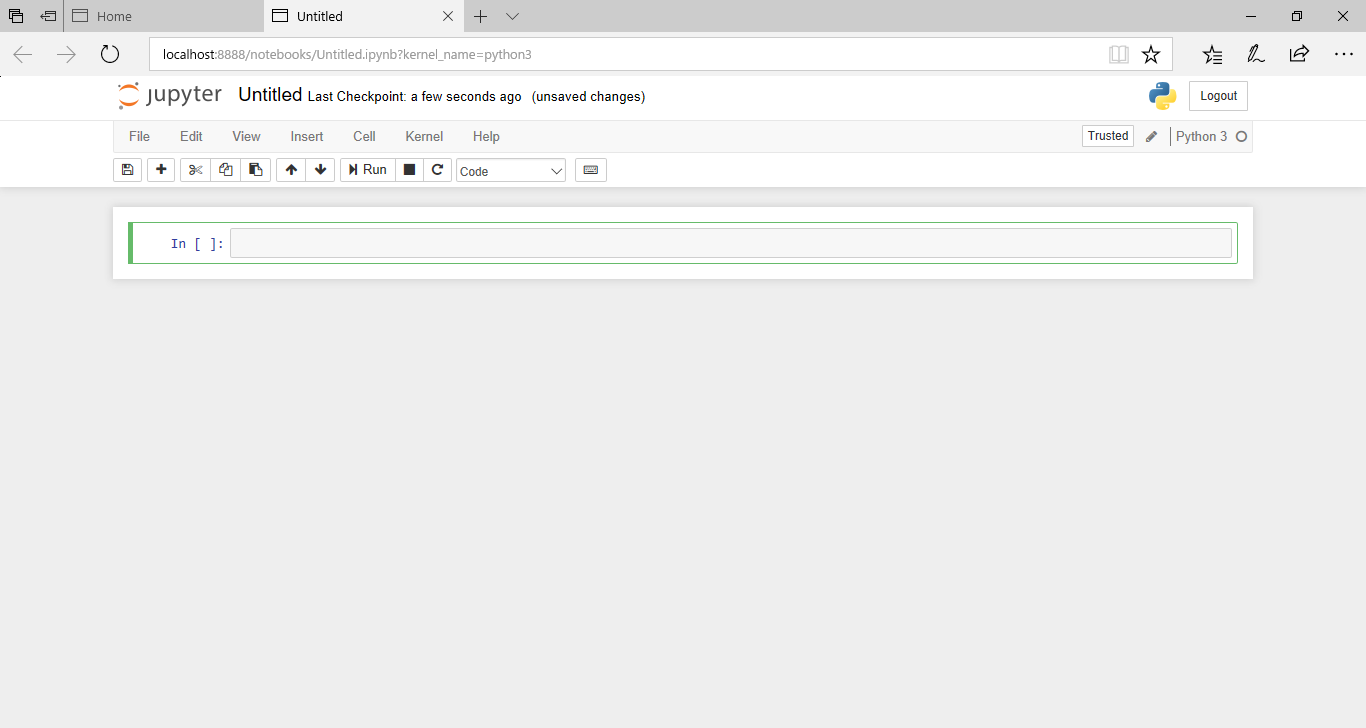
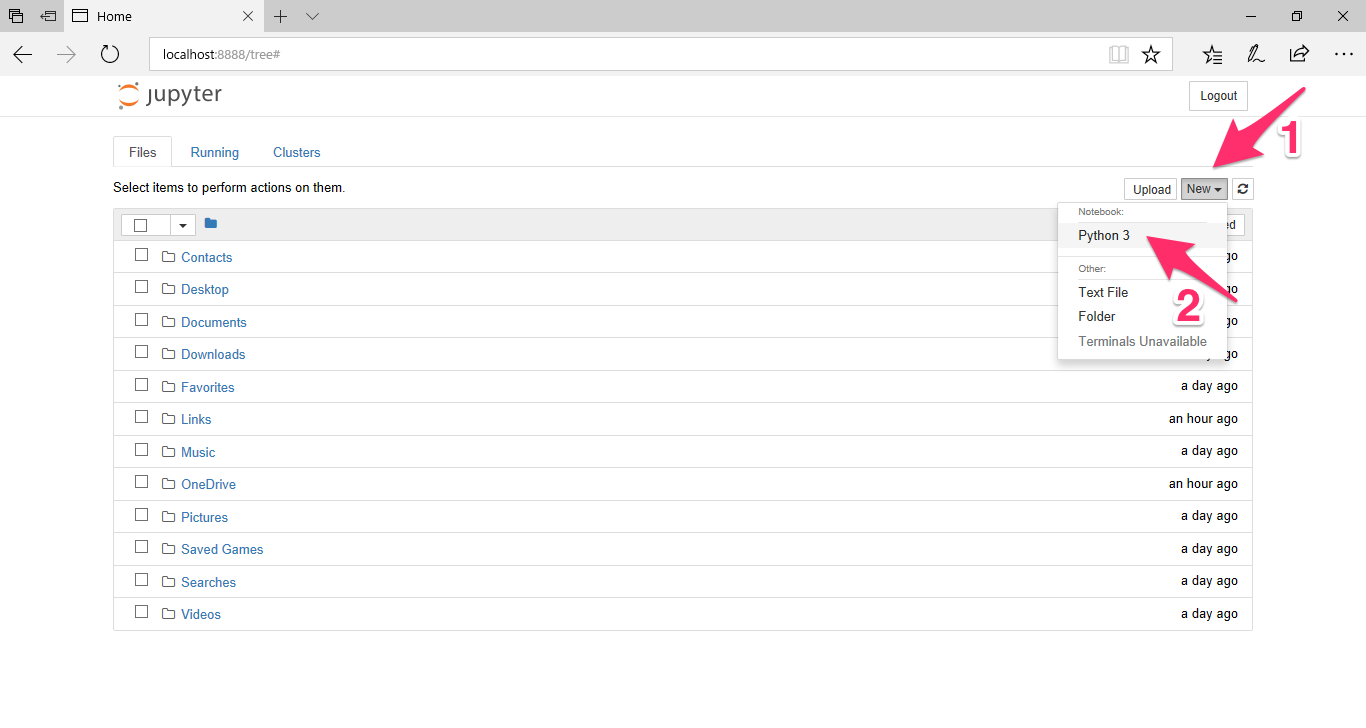
New から Python 3 を選択します。
すると、新しいノートブックが作成されます。
#ref(): File not found: "new_notebook.png" at page "機械学習/Pythonでデータ分析するはじめの一歩(Windows編)"
scikit-learn †
標準で入っているirisデータをSVM (SVC)で学習してみます。
入力ボックスにPythonのプログラムを入力し、実行ボタンをクリックするか、Shiftキーを押しながらreturnキーを押して実行します。
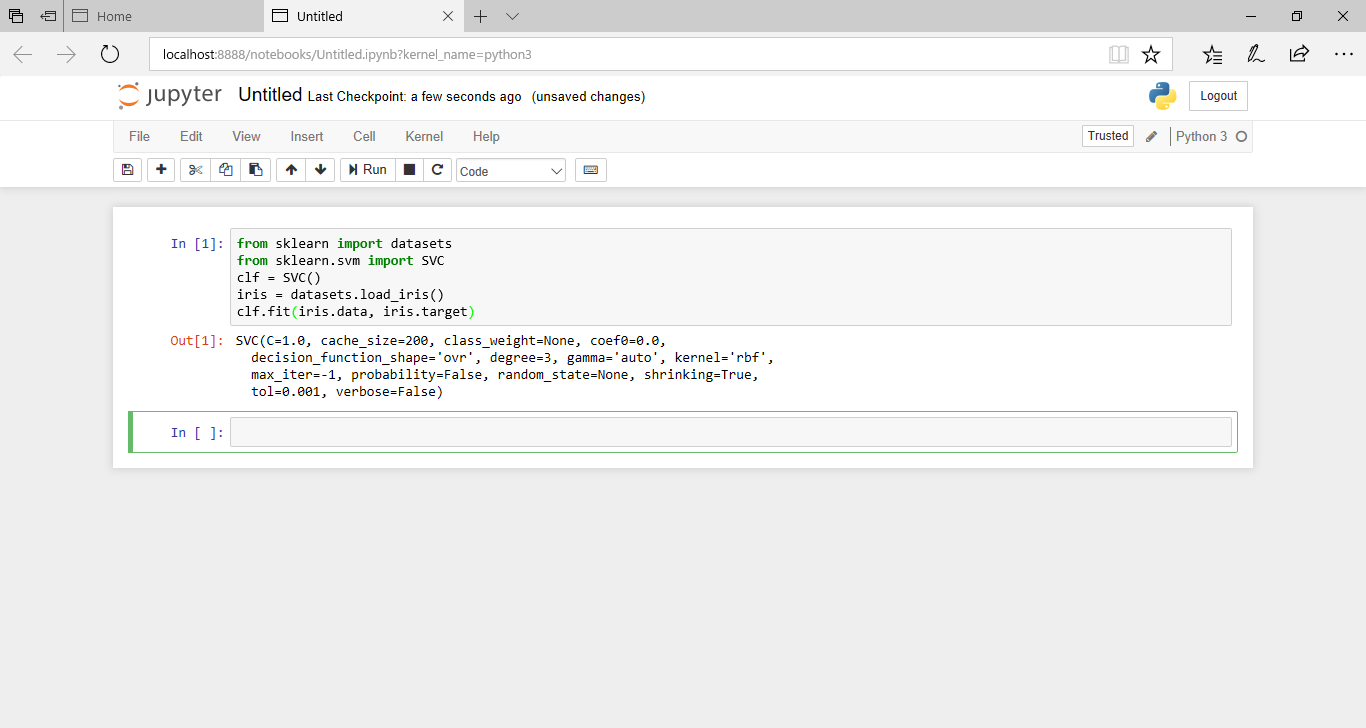
from sklearn import datasets
from sklearn.svm import SVC
clf = SVC()
iris = datasets.load_iris()
clf.fit(iris.data, iris.target)
pandas †
pandasの動作を確認するため、irisデータをpandasに入れます。
まずは、irisのデータをそのまま表示してみます。
iris.data
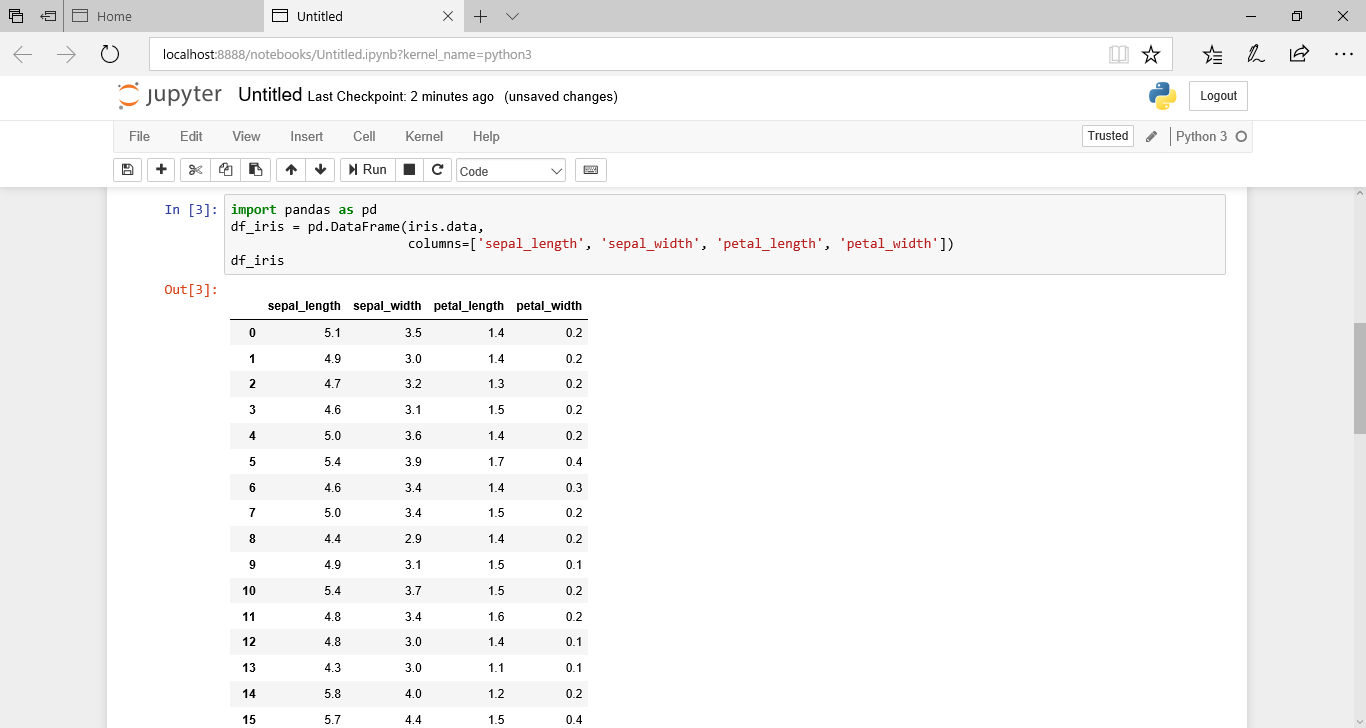
次に、iris.dataをpandasのDataFrameに入れて表示してみます。
import pandas as pd
df_iris = pd.DataFrame(iris.data,
                       columns=['sepal_length', 'sepal_width', 'petal_length', 'petal_width'])
df_iris
![[PukiWiki] [PukiWiki]](https://xn--p8ja5bwe1i.jp:443/wiki/image/banner.png)